Meshgrid for numerical computations
The meshgrid function in NumPy is a powerful tool for creating coordinate matrices from coordinate vectors, and it has several important advantages, especially in the context of numerical computations and visualizations. Here’s an overview of the advantages and typical use cases of meshgrid:
Advantages of meshgrid
Creating Coordinate Grids: - meshgrid generates coordinate matrices from coordinate vectors, which are useful for evaluating functions over a grid in 2D or 3D space. This is particularly important in numerical simulations, data visualization, and mathematical computations.
Simplifies Function Evaluation: - When you have a function of two variables (e.g., ( f(x, y) )), meshgrid helps you evaluate this function over a grid of ((x, y)) pairs, making it easier to compute and visualize functions over a domain.
Facilitates Visualization: - It is commonly used for creating surface plots and contour plots. By generating a grid of points, you can evaluate a function over that grid and then plot the results, which is essential for understanding the behavior of multivariate functions.
Vectorized Operations: - meshgrid allows for vectorized computations, which are typically faster than using nested loops. This leverages NumPy’s efficient array operations to perform calculations over the entire grid at once.
Supports Multi-Dimensional Grids: - Although commonly used for 2D grids, meshgrid can also be extended to higher dimensions, allowing for the creation of coordinate grids in 3D and beyond.
Basic Usage
Here’s how meshgrid works in practice:
import numpy as np
import matplotlib.pyplot as plt
# Define the coordinate vectors
x = np.linspace(-5, 5, 10)
y = np.linspace(-5, 5, 10)
# Create coordinate matrices
X, Y = np.meshgrid(x, y)
# Define a function to evaluate
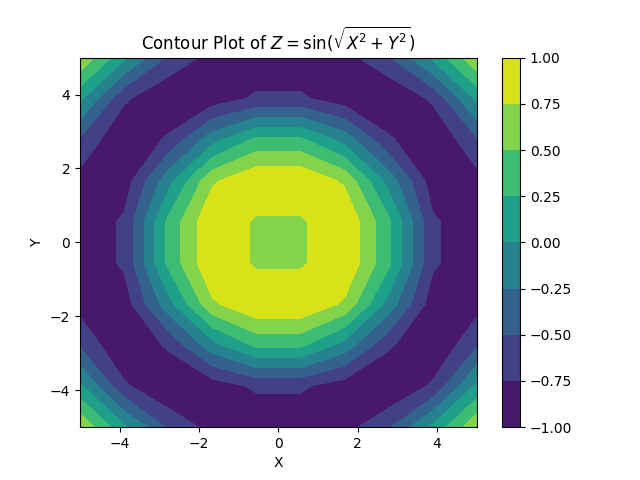
Z = np.sin(np.sqrt(X**2 + Y**2))
# Plot the result using a contour plot
plt.imshow(Z, cmap='viridis')
plt.colorbar()
plt.title('Contour Plot of $Z = \sin(\sqrt{X^2 + Y^2})$')
plt.xlabel('X')
plt.ylabel('Y')
plt.show()
This example give this figure:
Coordinate Vectors: - x and y are the coordinate vectors defining the range and spacing for the grid.
Generate Coordinate Matrices: - np.meshgrid(x, y) produces two 2D arrays, X and Y, where each element of X and Y corresponds to a grid point in the Cartesian plane.
Function Evaluation: - Z is computed as a function of X and Y, producing a matrix of function values over the grid.
Visualization: - plt.contourf creates a filled contour plot of the function values over the grid, providing a visual representation of the function.
What meshgrid produces ?
To understand how the meshgrid function works, you can read this ressource: Numpy / Meshgrid PDF