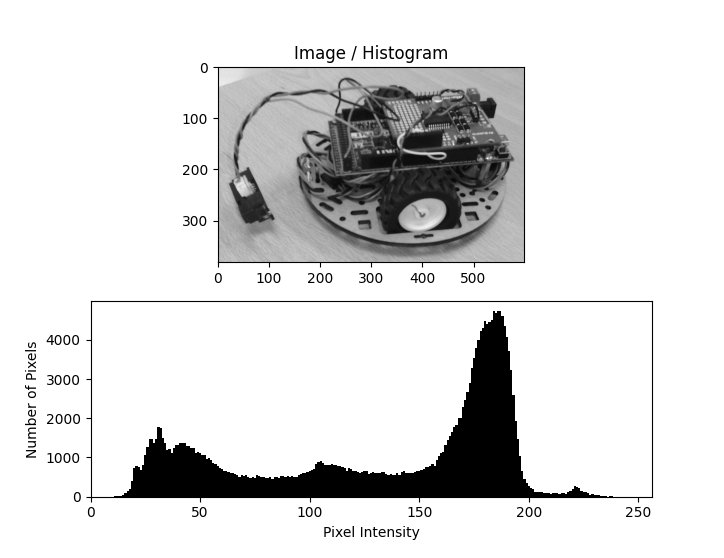
Histogram of an image
A histogram of an image is a graphical representation that shows the distribution of pixel intensity values in that image. It plots the number of pixels for each intensity level, ranging from 0 to 255 in an 8-bit grayscale image (where 0 represents black and 255 represents white).

Fig. 6 Image (top) and its histogram (bottom).
Key components of an histogram
X-Axis (Intensity Levels)
The X-Axis represents the possible pixel intensity values.
For grayscale images, it goes from 0 (black) to 255 (white).
For color images (RGB), there are 3 separated histograms for Red, Green, and Blue channels, each ranging from 0 to 255.
Y-Axis (Frequency of Pixels)
The Y-Axis represents the number of pixels in the image that have each specific intensity value.
The height of each bar in the histogram shows how many pixels in the image have that particular intensity.
Purpose and application of a histogram
Contrast
A histogram can help assess the contrast of an image. A wide spread of pixel values across the histogram usually indicates good contrast, while a narrow spread might indicate low contrast.
Brightness
The position of the histogram can indicate the brightness. If the histogram is skewed to the right, the image is likely brighter; skewed to the left, it’s darker.
Exposure
A histogram can help identify overexposed or underexposed areas in an image. A histogram bunched up on the left indicates underexposure, while a bunch on the right suggests overexposure.
Example in Practice
IMAGES ?
High Contrast Image: The histogram will have pixel values spread out across the entire range.
Low Contrast Image: The histogram will be narrow, with pixel values clustered around a central range.
Bright Image: The histogram will be skewed to the right.
Dark Image: The histogram will be skewed to the left.